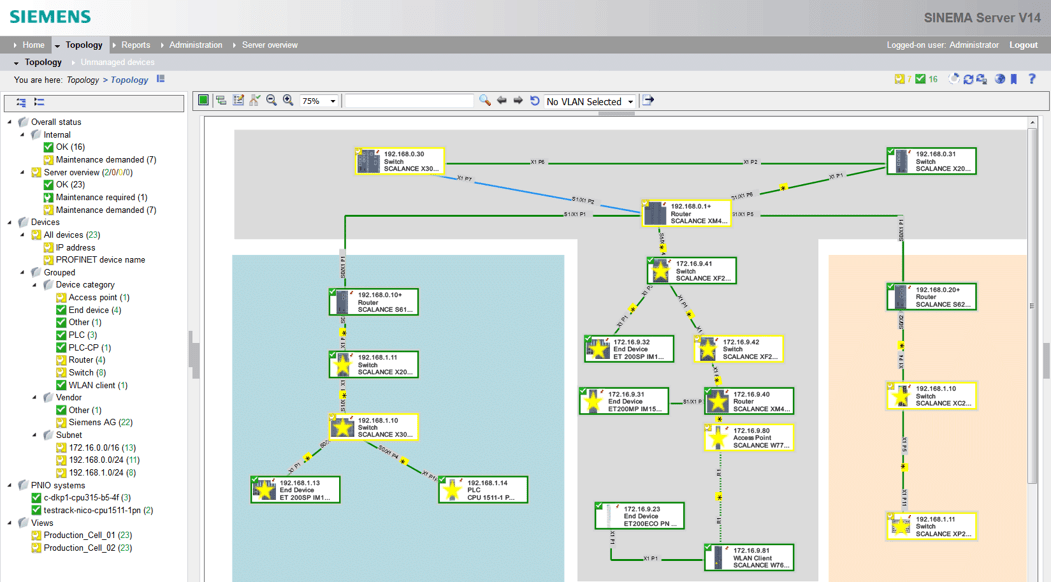
Example of diagnostics tool with topology overview
PROFINET offers an unprecedented level of diagnostics capability, both locally and remotely using standardized displays.
READ MORE...
Diagnostic overviews provide levels of detail according to your needs, showing device, module, channel and interrupt activity. Current fault events can be acknowledged and PROFINET’s I&M (Identification and Maintenance) functions are facilitated at the same time. Comprehensible naming conventions mean you don’t have to look up obscure tag names or numbers before getting down to business. Even topology layouts showing the geography of your plant network become possible with PROFINET.
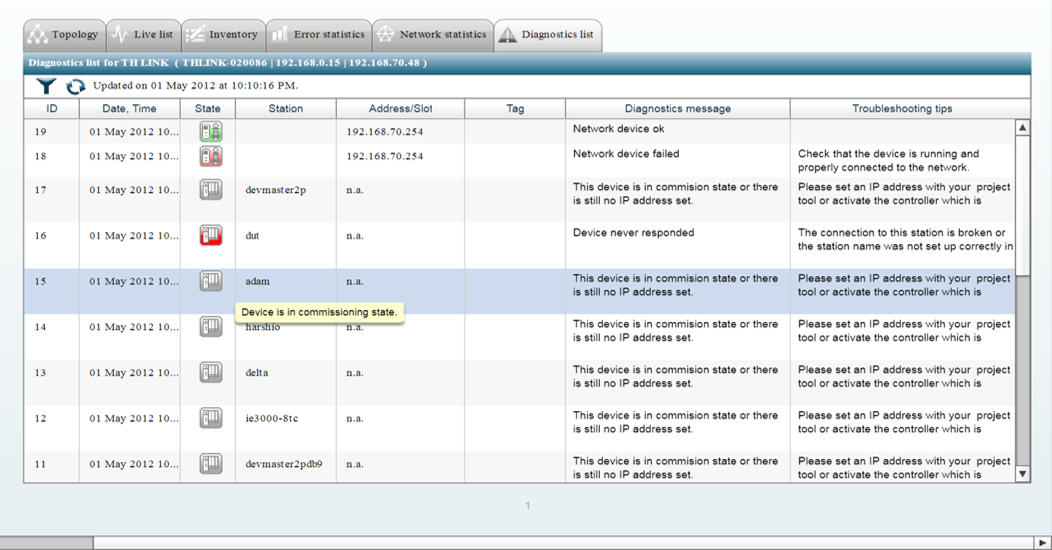
Example of diagnostics web interface-comprehensive diagnostics messages
Integrated web servers are incorporated in automation devices and these mean that a standard Internet browser can be used to access diagnostic displays. It also means that engineers don’t necessarily have to be on site in order to diagnose a fault as access to plant networks can easily be facilitated over an intranet or even the internet. Automated, event-driven messages can be dispatched by SMS or e-mail to your engineering staff.
Cable diagnostics are just as simple. Again, displays are standardized to give accurate topology views of the network for fast location of faults. Standard Ethernet tools such as SNMP and Ethereal can be utilized. There’s also easy access to vendor-specific tools for complex devices.
Watch this webinar on Diagnostics:
Network Diagnostics and PROFINET